Introduction
"Low odds mean it's a safe bet" or "high payout means good value" — do you judge odds this way?
Actually, the odds number alone can't tell you whether a bet is good or bad. What matters is the concept of expected value. This article explains how odds work, how to calculate expected value, and practical ways to avoid the "overpopularity trap" and turn a profit.
What Are Odds? — Understanding How Payouts Work
Odds are the multiplier showing how much you get back per ¥100 wagered if your bet wins.
Japanese boat racing uses a pari-mutuel system. The total amount wagered by all bettors has roughly a 25% deduction (the operator's cut) taken out, and the remainder is split among winning tickets.
| Item | Description |
|---|---|
| Total wagers | Sum of all bettors' purchases |
| Deduction rate | About 25% (operator's share) |
| Payout pool | Total wagers × about 75% |
| Odds | Payout pool ÷ number of winning tickets ÷ ¥100 |
Key point: Odds are not "a prediction of the race result" — they're a reflection of how bettors' money is distributed. When many people bet on something, its odds drop; when few do, its odds rise.
Reading Odds by Bet Type
Win (Tansho) and Place (Fukusho) Odds
The simplest bets. Win means picking the 1st place boat out of 6.
- Win odds of 1.5x → ¥100 becomes ¥150 (profit ¥50)
- Win odds of 8.0x → ¥100 becomes ¥800 (profit ¥700)
The Win odds for a Class A1 racer in lane 1 are often around 1.2–2.0x — a small payout but a high hit rate.
Trifecta (Sanrentan) Odds
Picking 1st, 2nd and 3rd in exact order. With 120 possible combinations, this bet offers the highest potential payouts.
| Odds range | Approx. frequency | Character |
|---|---|---|
| Up to 10x | ~5% | The "sure thing" — thin margins |
| 10–50x | ~30% | Mid-range payout, a solid target |
| 50–100x | ~25% | The sweet spot for mid-longshots |
| 100x+ | ~40% | High payout including "mansyu" (10,000x+) — low hit rate |
Understanding Expected Value — The "True Worth" of a Bet
The Expected Value Formula
Expected value = Hit rate × Odds
The basic rule: 1.0 or above means "bet it," below 1.0 means "pass."
A Concrete Example
| Case | Hit rate | Odds | Expected value | Verdict |
|---|---|---|---|---|
| A | 50% | 1.5x | 0.75 | ❌ Pass |
| B | 30% | 4.0x | 1.20 | ✅ Bet |
| C | 10% | 15x | 1.50 | ✅ Bet |
| D | 5% | 12x | 0.60 | ❌ Pass |
Look at Case A. A 50% hit rate looks "safe" at first glance, but at 1.5x odds, you'll lose money over the long run. Case C, by contrast, has a lower hit rate of 10%, but at 15x odds the expected value of 1.50 means it's worth betting.
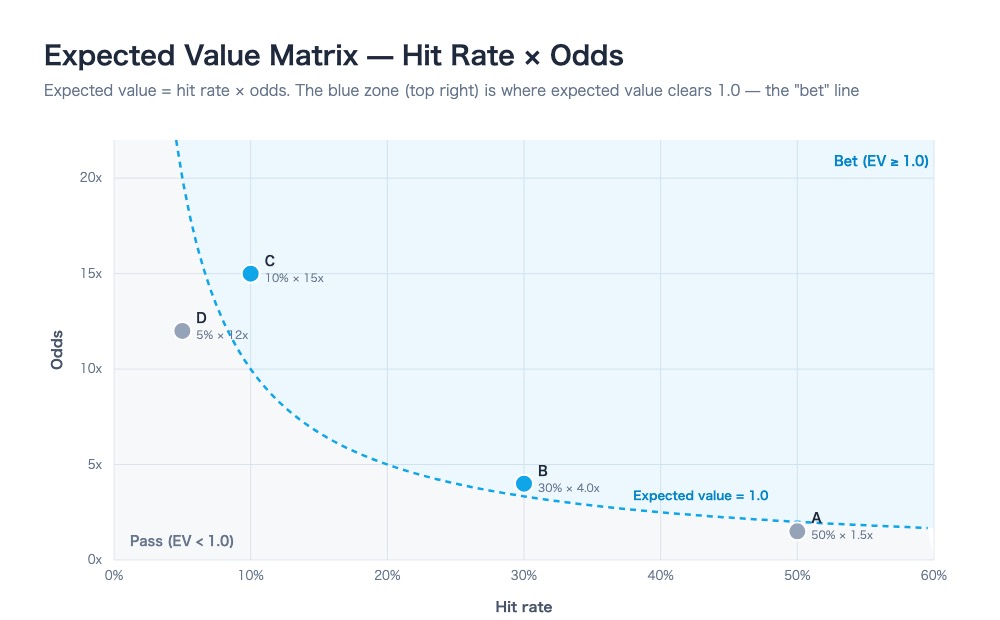
The chart above plots all four cases. B and C sit above the dashed expected-value-1.0 curve (in the blue "bet" zone), while A and D fall below it (in the gray "pass" zone) — the position tells you the verdict at a glance. Betting well isn't about hit rate or odds alone; it's about where their product lands relative to that curve.
The Overpopularity Trap — Why "Sure Things" Lose
What Is Overpopularity?
This happens when bettor attention concentrates on a specific racer, pushing the odds down below what the racer's actual ability warrants.
Typical patterns:
- A star SG/G1 racer starts in lane 1
- A race gets TV or media attention
- A racer who won decisively in their previous race
In these races, lane 1's Win odds can drop as low as 1.1x. Even with an 80% hit rate, the expected value is 0.80 × 1.1 = 0.88 — a negative expected value.
How to Spot Overpopularity
- Lane 1's Win odds at 1.3x or below → likely overpopularity
- The most popular Trifecta combination fixed on 1st place at 5x or below → little benefit to betting
- Betting money concentrates on lane 1 even when Class A racers are in lanes 2+
How to Target Odds Distortions
An odds distortion is a situation where the odds are higher than the actual probability of winning warrants. This is where positive-expected-value opportunities hide.
Where Distortions Tend to Appear
- A strong but unpopular racer starting from an outside lane — bettors tend to overvalue inside lanes
- A racer with good exhibition times but a poor recent record — bettors tend to be swayed by recent results
- A racer with a high motor 2-place rate but low name recognition — often undervalued by bettors who don't check the data
- Races with rough weather or changing water conditions — bettor prediction accuracy drops when conditions change, creating odds distortions
Practice: 2 Steps
- Pick a race with volatile conditions (wind speed, wave height, closely matched racer ability), then cross-reference motor performance, exhibition times, and course-specific records to form your own hit-rate estimate
- Check whether the odds clear expected value 1.0 relative to that hit rate
Data: What Odds Level Is Worth Targeting?
With a 25% deduction rate, the expected return rate on random bets is 75%. To beat that, you need to choose bets where the hit rate is high enough relative to the odds.
| Bet type | Approx. average hit rate | Break-even odds | Target odds |
|---|---|---|---|
| Win | 16.7% (1 in 6) | 6.0x | 7x+ |
| Quinella | 6.7% | 15x | 18x+ |
| Exacta | 3.3% | 30x | 35x+ |
| Trio | 5.0% | 20x | 25x+ |
| Trifecta | 0.8% | 120x | 40–80x (when narrowing picks) |
*Trifecta target odds are lower because narrowing down your picks raises the effective hit rate.
The key point: Don't just chase odds higher than average — identify the odds range where your own prediction accuracy turns a profit. For races where you can improve your hit rate, even lower odds can carry a positive expected value.
Finding High-Expected-Value Bets with Ryujin Radar
Ryujin Radar generates predictions by analyzing motor performance, racer data, course-specific records, exhibition times and more.
How to use Ryujin Radar for this:
- Read the finish order with turn predictions — visualize the race up to the first turn, cross-check against Ryujin Radar's tracked hit rate, and spot gaps against the odds
- Use the Upset Index to read a race's character — lean toward longshots in races flagged "Upset alert (high)," and toward favorites in races flagged "Favorite friendly"
Don't just bet on the odds — cross-reference Ryujin Radar's data-driven predictions with the odds to find bets with positive expected value. That's the first step toward a stable long-term return rate.
👉 Find odds distortions with Ryujin Radar
Summary
| Mindset | Result |
|---|---|
| "Low odds = safe = bet it" | Gets caught in overpopularity traps and loses |
| "High odds = longshot = good value" | Hit rate too low, loses anyway |
| "Target expected value = hit rate × odds ≥ 1.0" | Aims for long-term profit |
Odds aren't just a multiplier — they're a number that reflects bettor psychology. Spotting the distortions the majority overlooks, backed by data, is what leads to winning.
FAQ
If expected value is positive, why don't I win every time?
Expected value describes the average outcome if you repeated the same bet many times — it doesn't guarantee any single race's result. Even a bet with an expected value of 1.5 will lose more often than it wins in any given race. The statistical edge only shows up in your results after you consistently choose positive-expected-value bets across many races.
Can you really beat the 25% deduction rate over the long run?
In theory, yes — but it isn't easy. Random betting converges to roughly a 75% return rate because of the deduction. To beat it, you need to consistently spot odds distortions (bets where the odds are generous relative to the true hit rate). The key is not betting every race — skip races where expected value falls below 1.0, and bet only when the conditions line up. That's the realistic path to beating the deduction.
How do I estimate hit rate in the first place?
Relying on gut feeling alone makes you prone to the overpopularity trap. A more solid approach combines multiple data points — motor 2-place rate, course-specific win rate, exhibition times, and more. Ryujin Radar's analysis data and its tracked turn-prediction hit rate are useful reference points for estimating hit rate yourself.
Do odds keep changing right up until the betting deadline? What are "final odds"?
Yes. Odds shift continuously as bettors place wagers, right up until betting closes. Popular racers' odds can drop further in a late rush of bets just before the deadline. The odds locked in the moment betting closes — the ones actually used to calculate payouts — are the final odds. Calculating expected value closer to that moment gives you a more accurate read than checking odds well ahead of post time.
Tags: #BoatRacing #BoatRace #Odds #ExpectedValue #OddsDistortion #Overpopularity #BettingStrategy #ReturnRate #DataAnalysis #RyujinRadar