The single biggest factor deciding a boat race is the first turn mark. All 6 boats launch at once, and who rounds that first turn first is said to decide about 80% of the race.
Ryujin Radar includes a "Turn Prediction" feature that statistically predicts how the race will unfold at that first-mark turn. This article breaks down how the feature works and how to use it.
Why does the first mark matter so much?
Unlike horse racing or bicycle racing, boat racing takes place on the water. Passing another boat on the water is extremely difficult, so the boat that takes the lead tends to hold it wire-to-wire.
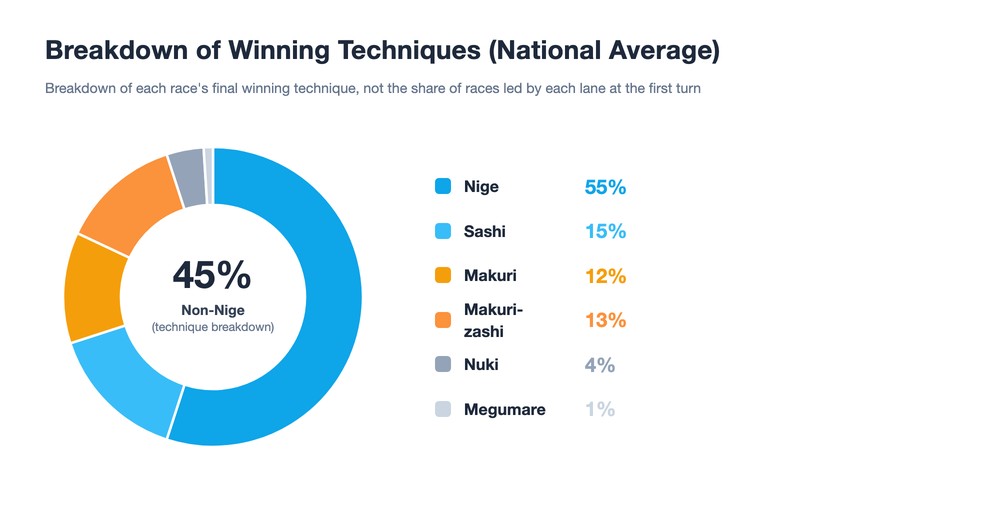
Breakdown of winning techniques (national average)
| Technique | Description | National average frequency |
|---|---|---|
| Nige (wire-to-wire) | Lane 1 holds the lead the whole way | ~55% |
| Sashi (inside pass) | An inside boat cuts inside the leader | ~15% |
| Makuri (overtake) | An outside boat blows past on pure speed | ~12% |
| Makuri-zashi (overtake-and-pass) | An overtake that also slips inside another boat | ~13% |
| Nuki (slip-through) | A pass that happens after the 2nd turn onward | ~4% |
| Megumare (lucky win) | A boat moves up after the leader crashes or capsizes | ~1% |
By winning technique, Nige accounts for about 55% and techniques other than Nige for about 45%. Note that this table is a breakdown of each race's final winning technique, and it also includes techniques such as Nuki that are decided after the 2nd turn onward. The winning-technique breakdown is not the same as the share of races in which each lane leads at the first mark. Being able to predict developments that end in a technique other than Nige opens up real opportunities for higher-payout bets.
How Ryujin Radar's turn prediction works
Ryujin Radar's turn prediction is built from a statistical model that integrates multiple data sources. Rather than a simple "lane 1 is strong" rule, it multiplies each racer's individual tendencies against the specific race conditions to forecast how the race will develop.
The data it uses
The turn prediction combines the following data points.
1. Each racer's winning-technique distribution (attacking pattern)
A statistical breakdown of which technique a racer has historically won with, and from which lane.
For example, if a racer's record from lane 2 is:
- Inside pass: 65%
- Overtake: 25%
- Overtake-and-pass: 10%
then this racer's wins from lane 2 come mostly via an inside pass. Note, however, that this example is the breakdown of winning techniques in the races they won from lane 2. It is not the same as the probability of winning via an inside pass across all of their starts from lane 2.
2. Lane-1 defensive strength (defensive pattern)
A statistical breakdown of which technique tends to beat a racer when they're in lane 1.
For example:
- Wire-to-wire success rate: 85% (strong defense)
- Rate of being overtaken: 8%
- Rate of being passed inside: 7%
If this racer is in lane 1, the model can predict a race where the inside lane holds firm.
3. Start timing (ST)
Start timing is one of the most important inputs for the turn prediction. Ryujin Radar combines two different ST data sources.
| Data | Weight | Character |
|---|---|---|
| Exhibition ST | 55% | Reflects same-day start feel |
| Average ST | 45% | Reflects the racer's long-term start ability |
Exhibition ST reflects how a racer feels on the day, but it doesn't always match the actual race. Blending it with average ST produces a more stable prediction.
4. Motor performance
The model evaluates the motor's current performance from its 2nd-place-or-better rate, and adjusts the probability of each winning technique accordingly.
- A high motor 2nd-place rate → overtakes and overtake-and-passes are more likely to land
- A low motor 2nd-place rate → a comeback from an outside lane is harder to pull off
5. Overall racer ability
The model calculates each racer's overall ability from their national win rate, venue-specific win rate, and class (A1/A2/B1/B2).
How to read the turn prediction
Ryujin Radar's race detail page shows the turn prediction two ways.
1. The "AI Prediction" tab and "Ryujin Sonar"
On the race detail page, the "AI Prediction" tab shows the candidates likely to finish 1st, ranked by probability. To check past developments under specific conditions, open the separate "Ryujin Sonar" tab.
2. The detailed turn-data table
Shows each racer's attacking and defensive patterns as numbers.
Things to check:
- Lane 1's wire-to-wire rate: 80%+ signals a solid race; 60% or below signals possible volatility
- Outside-lane overtake rate: a high number here signals a chance at a big payout
- Race count by lane: a low sample (under 10 races) means lower confidence in the data
Betting strategy using the turn prediction
Spotting a solid race
When the following conditions line up, an inside wire-to-wire win becomes highly likely.
- ✅ The lane-1 racer's wire-to-wire rate is 80%+
- ✅ The lane-1 racer's ST is fast (0.15 or better)
- ✅ No strong overtaker sits in the outside lanes
- ✅ The lane-1 racer's motor has a high 2nd-place-or-better rate
→ Target the favorite: Anchor Trifecta and Trio bets around lane 1
Spotting a volatile race
When the following conditions are present, an upset becomes more likely.
- ⚠️ The lane-1 racer's wire-to-wire rate is 60% or below
- ⚠️ An outside racer (lanes 3–6) has an overtake rate of 30%+
- ⚠️ The lane-1 racer's ST is slow (0.20 or worse)
- ⚠️ An outside lane has a high motor 2nd-place-or-better rate
→ Target a longshot: A Trifecta anchored around a lane 2–4 racer for 1st can pay off big
Also useful for predicting 2nd and 3rd place
The turn prediction isn't only useful for 1st place — it also helps predict 2nd and 3rd place.
- If the inside boat wins wire-to-wire → the lane-2 boat that chased with an inside pass often takes 2nd
- If an overtake lands → the boat just inside the overtaking racer often takes 3rd
- With an overtake-and-pass → the inside lane often holds on for 2nd
Knowing these patterns makes building a Trifecta bet dramatically easier.
Tips for getting the most accurate turn predictions
Pay attention to race count by lane
The turn prediction's accuracy depends heavily on how much data is behind it.
| Races by lane | Data confidence |
|---|---|
| 30+ races | ⭐⭐⭐ High |
| 10–29 races | ⭐⭐ Standard |
| Under 10 races | ⭐ Reference only |
If a racer in the detailed turn-data table has a low race count, their turn prediction is adjusted toward the national average. Don't over-rely on it in that case.
Check it alongside the exhibition ST
The turn prediction is recalculated using exhibition ST, which updates shortly before the race.
- The exhibition run happens about 30 minutes before the race
- Ryujin Radar automatically pulls in the exhibition ST
- The turn prediction updates with the latest data
Checking the data right before the race gives you a more accurate prediction to work from.
Summary: turn predictions show you "why" a pick was made
Ryujin Radar's turn prediction provides the reasoning behind a race's development that a plain AI score alone can't show.
- Each racer's attacking pattern: which technique they're skilled at, by lane
- Lane 1's defensive strength: whether the inside can hold wire-to-wire
- ST data: same-day start feel combined with long-term ability
- Motor performance: its effect on the odds of an overtake or inside pass landing
- The "AI Prediction" tab and "Ryujin Sonar": see 1st-place candidates ranked by probability, and check past developments under specific conditions
When you wonder "why is the AI favoring lane 1?", the turn prediction is the feature that shows you the reasoning behind it, backed by data.
If you're not sure how to build your bet, check the turn prediction first. It should make telling a solid race apart from a volatile one much easier.
Check Ryujin Radar's turn predictions now → https://boat-ai.jp/
FAQ
Does the turn prediction always hit?
No, it's a probabilistic prediction. The tracked hit rate for turn predictions is published on the performance page, and it isn't 100%. Treat it as reference information about which development is more likely, and make your own final call.
I don't understand the difference between Nige, Sashi, and Makuri
Nige is when lane 1 holds the lead the whole way. Sashi is when an inside boat cuts inside the leading boat to move ahead. Makuri is when an outside boat blows past on pure speed from the outside. Check these against the table above for more detail.
Can I trust the prediction for a racer with few starts on a given course?
It's less reliable, but not meaningless. Racers with limited data get a prediction corrected toward the national average, which keeps it from swinging to extremes but also makes it less reflective of that racer's specific tendencies. Treat it as one reference point among several.
When does the turn prediction update?
It's recalculated using exhibition-run data (exhibition ST) captured about 30 minutes before the race. Checking closer to post time gives you a prediction based on more current information.
Tags: #BoatRacing #TurnPrediction #FirstMark #WinningTechnique #AIPrediction #RyujinRadar